
What You Hear Is What You Get
Euphonics Testing for True Audio Transparency
By David Singleton & Paul Lesso
Introduction
The primary objective of delivering an exceptional audio experience is to achieve playback that remains as true as possible to the source material. This raises a critical question for the design of an audio playback system: how can we achieve the highest level of transparency? Transparency in this context meaning that the listener should be able to hear the music itself without any coloration or distortion introduced by the playback system.
To understand this better, it’s worth drawing a distinction between utility and euphonic measurements in audio playback systems. Utility measurements refer to those that are straightforward to quantify, such as Total Harmonic Distortion (THD), but often have a complex or weak correlation with the actual listening experience. In contrast, euphonic measurements directly relate to the perceived sound quality and audibility of a playback system, offering a more meaningful evaluation of how the system performs from the perspective of a listener. In the following sections, a series of euphonic measurements are introduced and demonstrated with examples. These measurements can often be more difficult to perform, and less straightforward to assess whether the measured performance is sufficient.
Measurement List
The 1Hz Test
Motivation
This test highlights how noise and other artefacts correlate with signal, which may be perceived as distortion and can sound very objectionable. Psychoacoustic research by Louis Fielder at Dolby Labs indicates that noise-floor shifts of just 2dB are audible, and tones modulating up to 30dB below the noise floor are detectable. There is an argument that such artefacts can sometimes be masked by larger sounds so here we propose a test that excites the playback system distortion but with an in-audible signal, thus making the distortion very audible. It is common in sigma delta DACs with poor quantization in the digital and/or modulator to hear the noise floor modulate at the stimulus frequency.
Method
-
Use a large (ideally full-scale) 1Hz input as a stimulus
-
Plot the spectrogram and examine behaviour within the audio band
-
Perform listening tests to see if any artefacts are perceptible
Maximizing Performance
This test uncovers many undesired characteristics that will be fundamental to the converter architecture. Choosing the right architecture is key to minimising the noise vs. DC level and ensuring the profile is smooth. Tonal behavior of the modulator should be minimized through appropriate dithering.
Examples
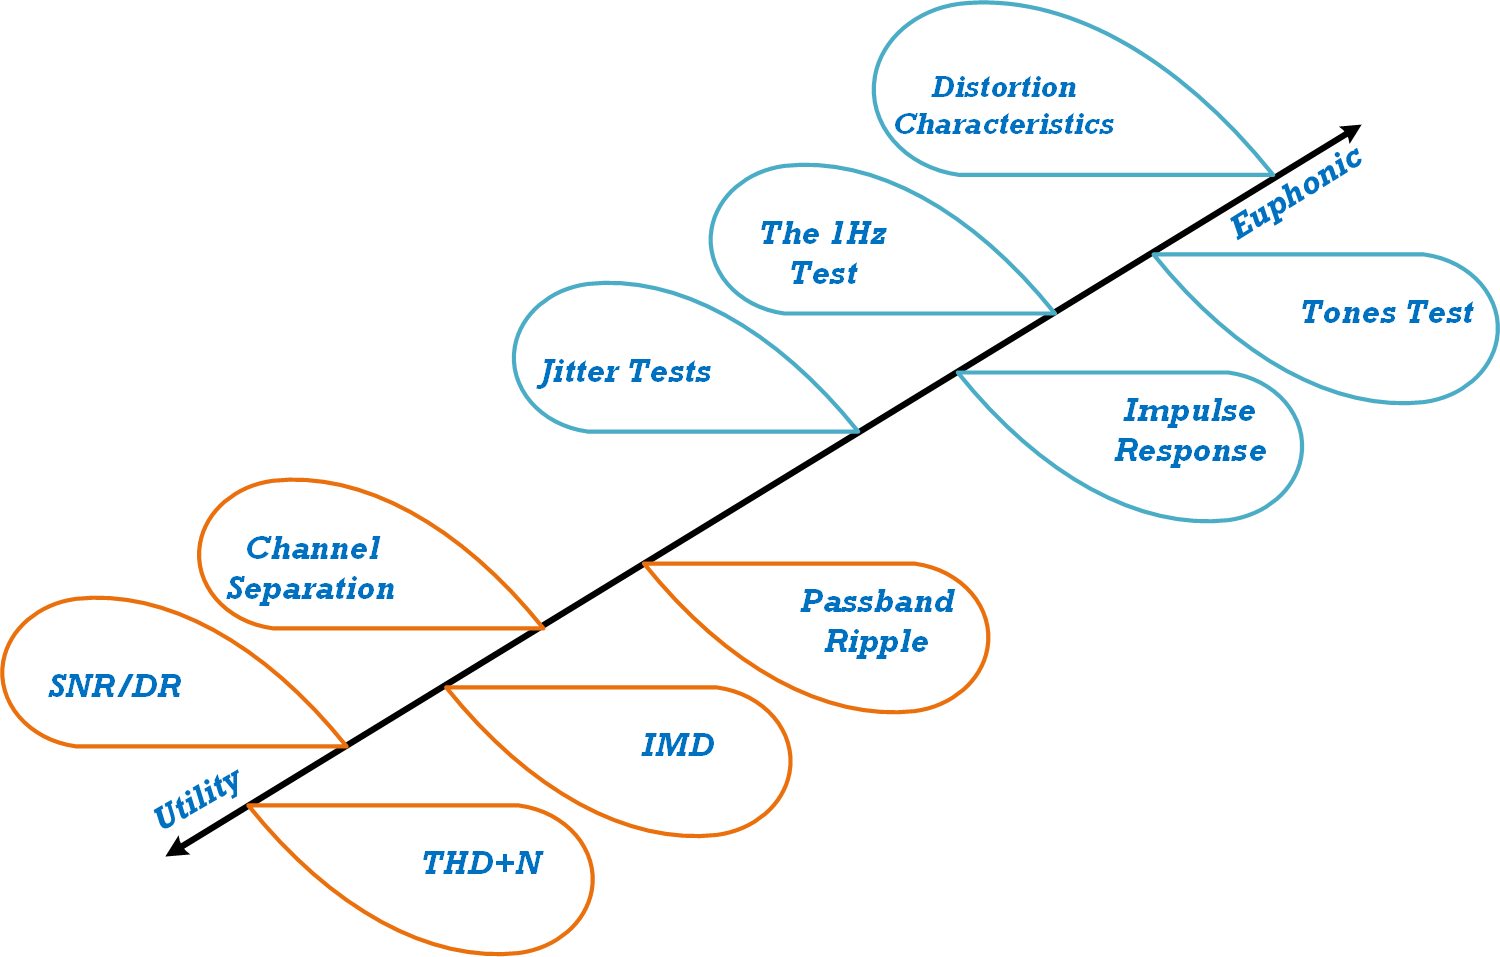
Example clean spectrogram:
-
Note the example looks white with no obvious patterning
Example noise floor modulation:

-
Note the bursts of white energy at low frequency, varying with time in a regular fashion with the input stimulus
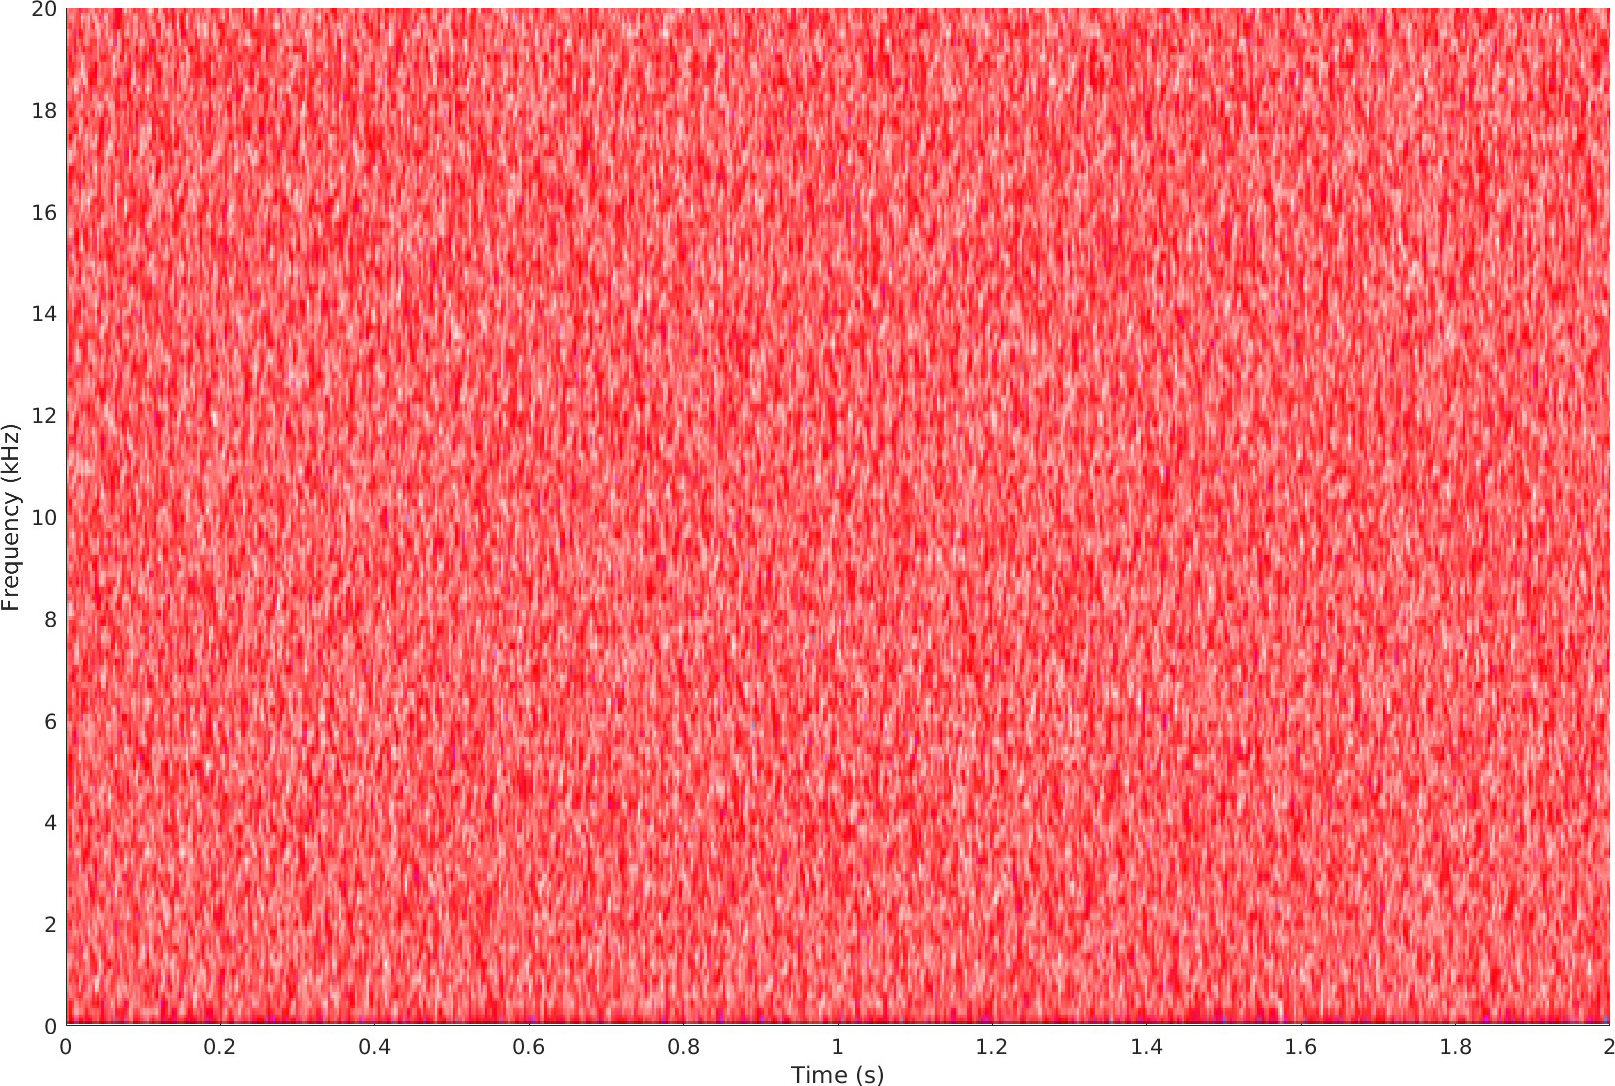
Example signal-dependent tones:
-
Note the horizontal red lines showing stationary tones, and vertical red lines at the lower frequencies which illustrate intermittent changes in the noise spectrum.
Tones Test
Motivation
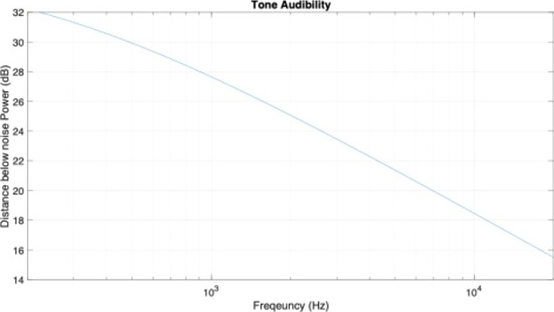
Looking at a simple FFT plot is not a good indicator of audibility of tones as the human ear can hear tones below the noise floor. In addition, by its nature the FFT shows the average power across the spectrum which can easily mask any warbling behavior of low-level tones. Based on Zwicker’s equation1, residual tones should be 15-32 dB below the noise floor, depending on the frequency:
Method
-
Perform an FFT on the output noise floor with very high averaging so that low amplitude tones can be observed. Select a suitable number of points and averages sufficient to resolve a noise floor at least 40dB below the converter noise floor.
-
This test can be combined with a 1Hz stimulus.
-
In addition, coherent and incoherent averaging can be performed to identify any unexpected characteristics.
-
Examining the autocorrelation of the modulator output is another good approach to check for the presence of tones.
Maximizing Performance
As with the 1Hz test, careful modulator design is required to ensure “white” (i.e. constant PSD) quantizer behavior. Carefully designed dither is again key to achieving this.
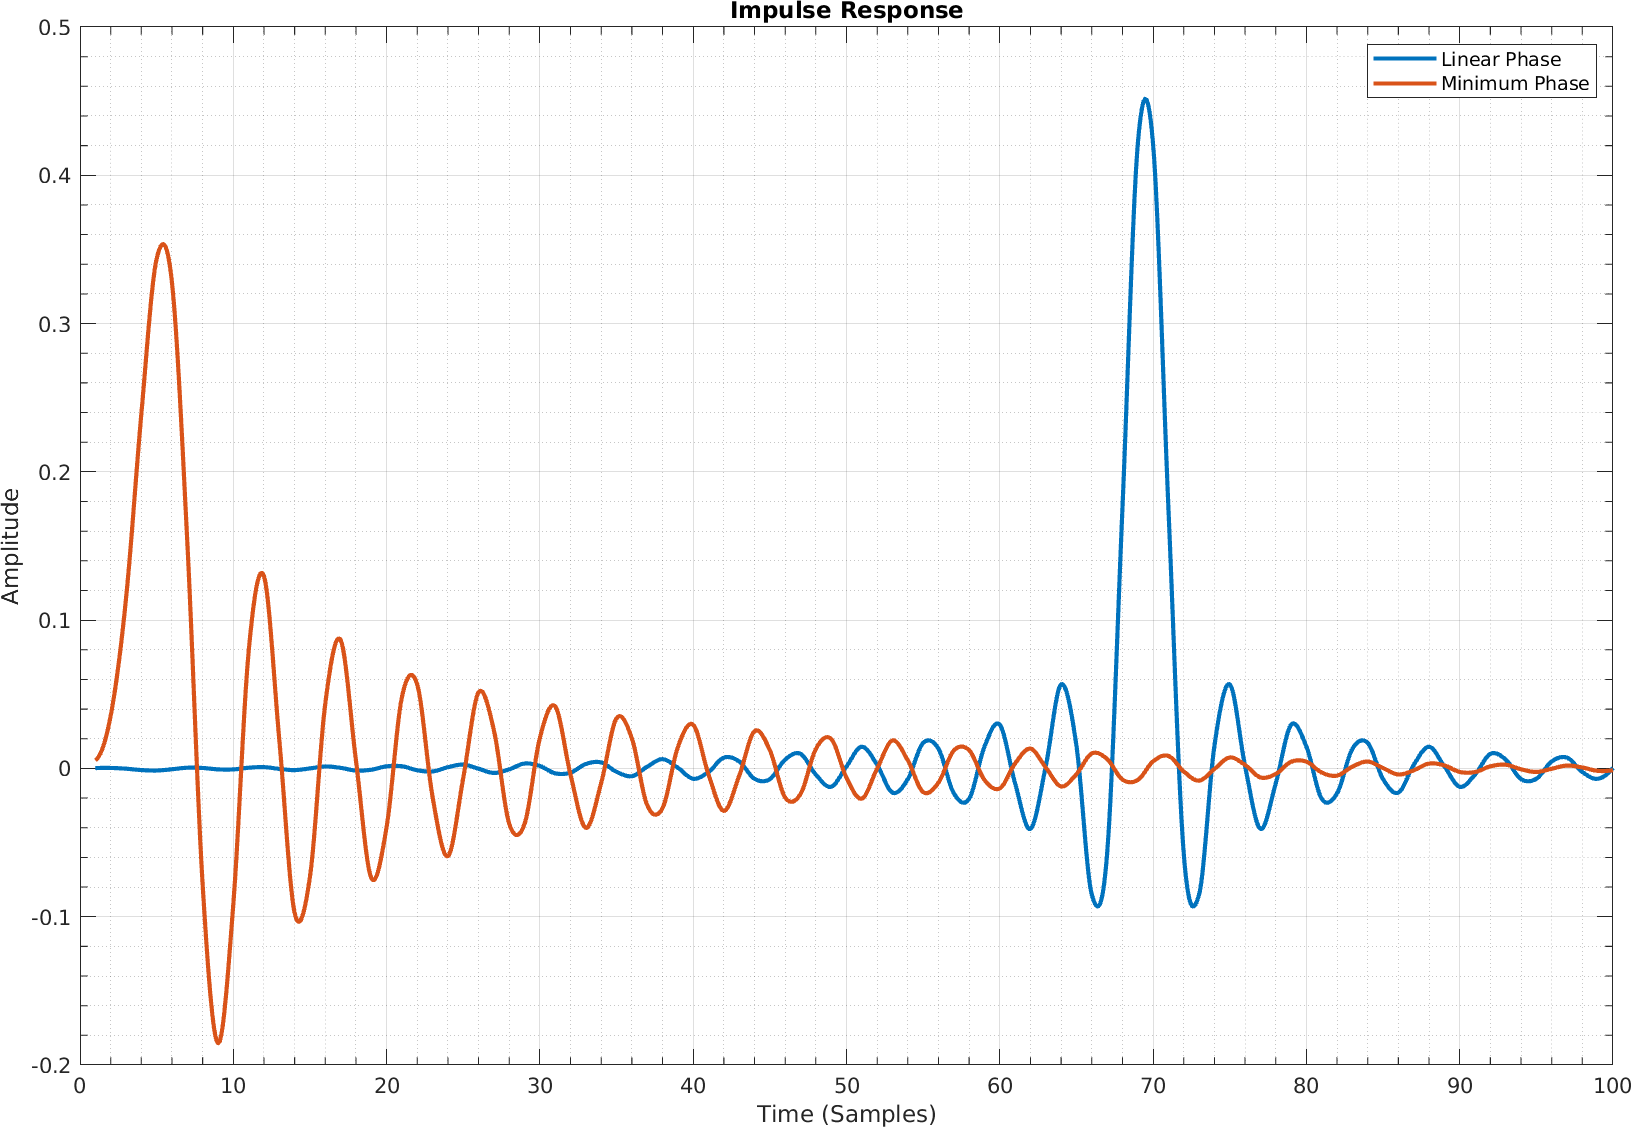
Impulse Response Measurement
Motivation
High levels of filter ringing can impair the quality of listening experience. Audio filters tend to be one of two forms – either minimum phase which has a minimum latency in exchange for group delay distortion and significant post-ringing, or a linear phase filter which has no group delay distortion but increased latency and pre-ringing. Pre-ringing rarely occurs in nature – as pre-ringing corresponds to hearing the effect of the sound source before the originating sound reaches the listener, which can sound particularly unnatural. While linear phase filters are better at preserving the original time-domain waveform, excessive ringing can effectively degrade the transient resolution of the system as short, fast transient signals start to blur across each other in time. As we want to let our customers select the filter type most appropriate to their needs, we aim to ensure an optimal impulse response for each one.
Method
-
Measure impulse response
Maximizing Performance
As opposed to the more cost-effective method of using a generic set of coefficients applied across all sample rates, filter options should be optimized with unique coefficients for each sample rate. This allows each impulse response to be finely tuned with minimized ringing, while providing trade-offs between passband width and stopband depth. By minimizing both pre- and post-ringing as much as possible, we maximize the transient resolution and transparency of the data path.
Examples
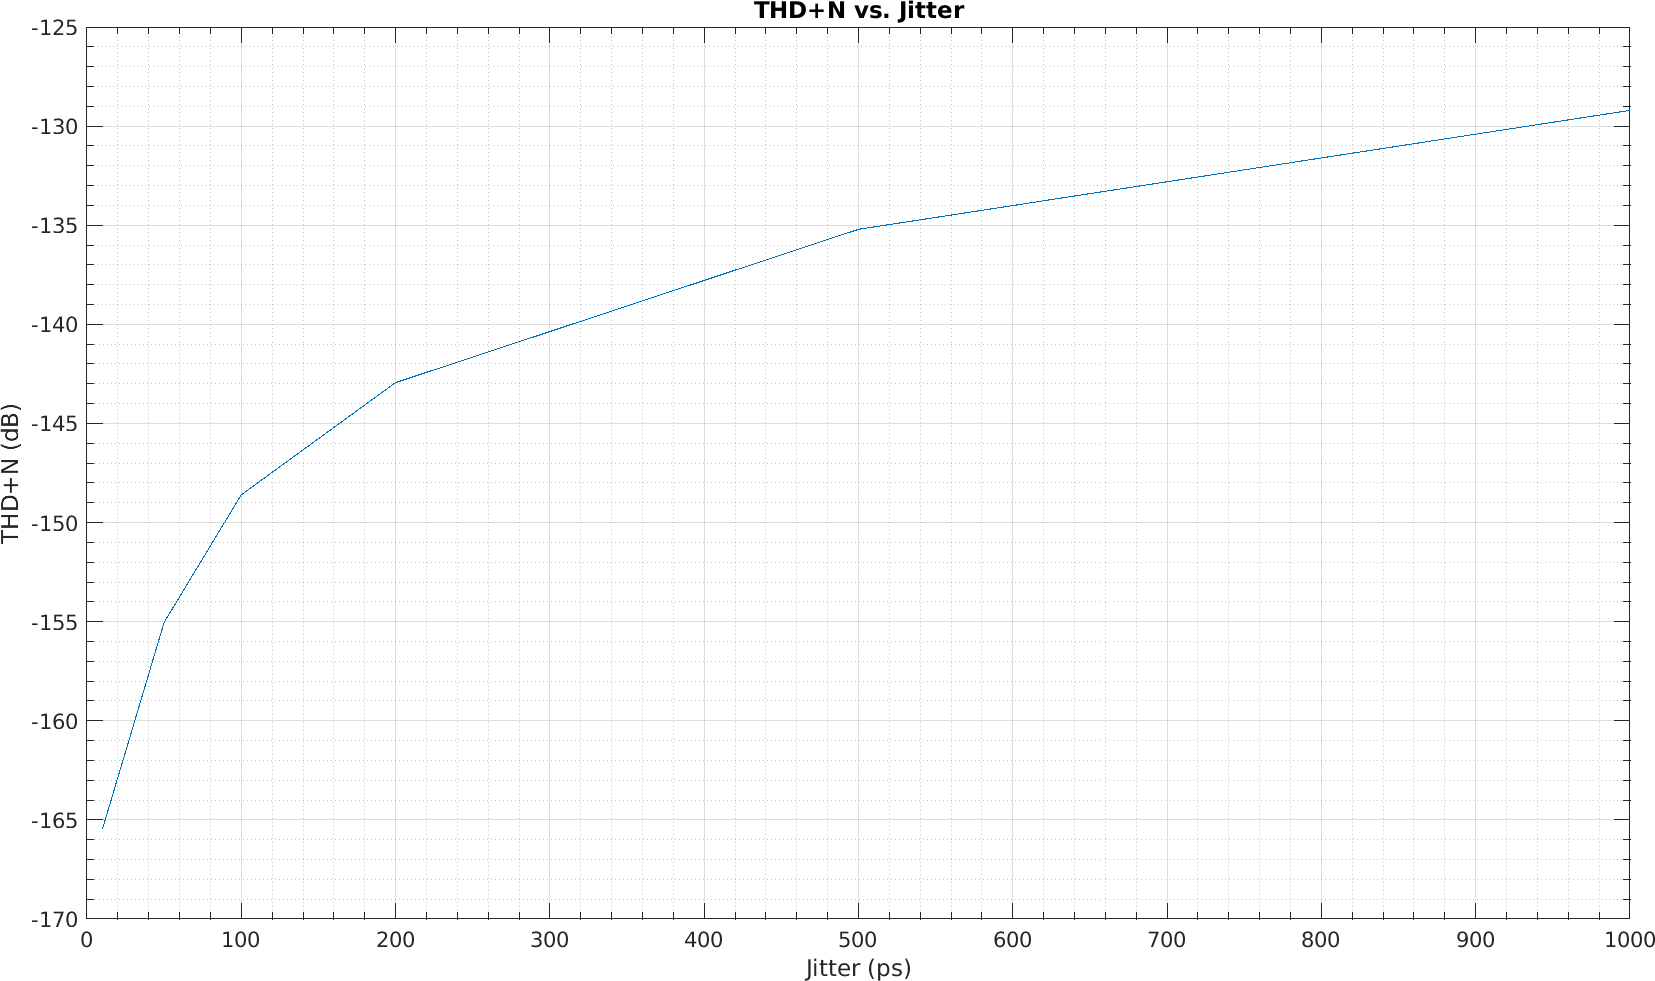
Jitter Test
Motivation
Jitter impacts all sampled converters, with the impact varying depending on the architecture selected. Resultant performance degradation can include reduction of dynamic range, down-modulation of out-of-band interference, baseband modulation of noise and/or distortion, and image modulation noise and/or distortion. Measurement of the converter clock jitter only tells half the story – we need to observe how the converter out-of-band profile mixes with the jitter profile.
Method
-
Measure key converter performance parameters with a range of jitter profiles applied to the clock source. This should include both noise and sinusoidal jitter.
-
Compare FFTs with a clean-clock reference to look for changes in noise and distortion profiles.
Maximizing Performance
Using as clean a clock as possible will help minimize any undesired jitter effects. One method to help achieve this is to use a PLL to reject jitter on a reference clock. Jitter sensitivity should be a key consideration during converter architecture selection. While typically being more sensitive to jitter than Discrete-Time converters, Continuous-Time converters can be improved through the addition of AFIRs to position notches in the spectral regions most susceptible to folding.
Examples
Example converter THD+N performance vs. amount of noise jitter on the clock source:
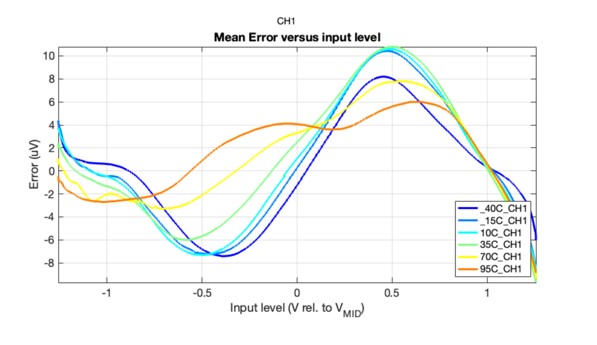
Distortion Characteristics
Motivation
While THD is a good measure of true linearity, the harmonic profile and phase relationships significantly change the audible acceptability. For example, zero-cross distortion can be much more objectionable than a cubic non-linearity which generates the same amount of distortion power.
Method
-
Explore the error over the signal range through signal processing to extract the time-varying error from the ideal response.
-
Plot the magnitude and phase of individual harmonics.
Maximizing Performance
The best return on effort is likely to be in the design of the analog circuits which dominate the linearity of the converter. This will require sufficiently accurate simulation methods, etc. Examining the curve shape and variation with temperature and key system voltages can provide strong clues as to where the performance is being limited.
Examples
This plot shows the movement of the main error peaks with temperature, consistent with diode leakage:
Assessing Performance
There is great benefit in performing euphonic measurements such as those described to recognize gross flaws and help identify design changes that demonstrate clear improvements. The performance can initially be assessed by visual inspection of the plots generated, and comparisons drawn to the same measurements made on other devices. Critical listening should also form part of the assessment if we want to understand the actual impact of a system’s response to these types of stimuli. With the 1Hz test, for example, the recordings can be played back with high gain to make any changes in noise floor audibly obvious. With the jitter tests, one can vary the quality of the clock while listening to a reference track to attempt to quantify when it begins to limit the perceived performance.
We suggest using one or more audibility models to further advance the interpretation of the results to compute whether any artifacts isolated by the euphonic measurements could be audible. Such models should account for the frequency sensitivity of human hearing as a function of sound pressure level (SPL), and masking effects in which louder sounds can mask the perception of quieter ones. By combining these elements, the approach enables the computation of an audibility measure that reflects human psychoacoustics more accurately than utility measurements such as THD.
Conclusion
This article has presented a distinction between utility and euphonic measurements in audio playback systems and reasoned why using a set of euphonic measurements is critical to evaluating the quality and transparency of a playback system. Such measurements should be integrated into the design cycle to ensure that the achieved results are acceptable. By combining this ethos with excellent headline datasheet specifications, Cirrus Logic provides its customers with the ability to achieve an exceptional listening experience.
Explore Cirrus Logic’s pro audio devices for a transparent audio experience.
References
1 Psycho-Acoustics: Facts and Models, Fastl/Zwicker
